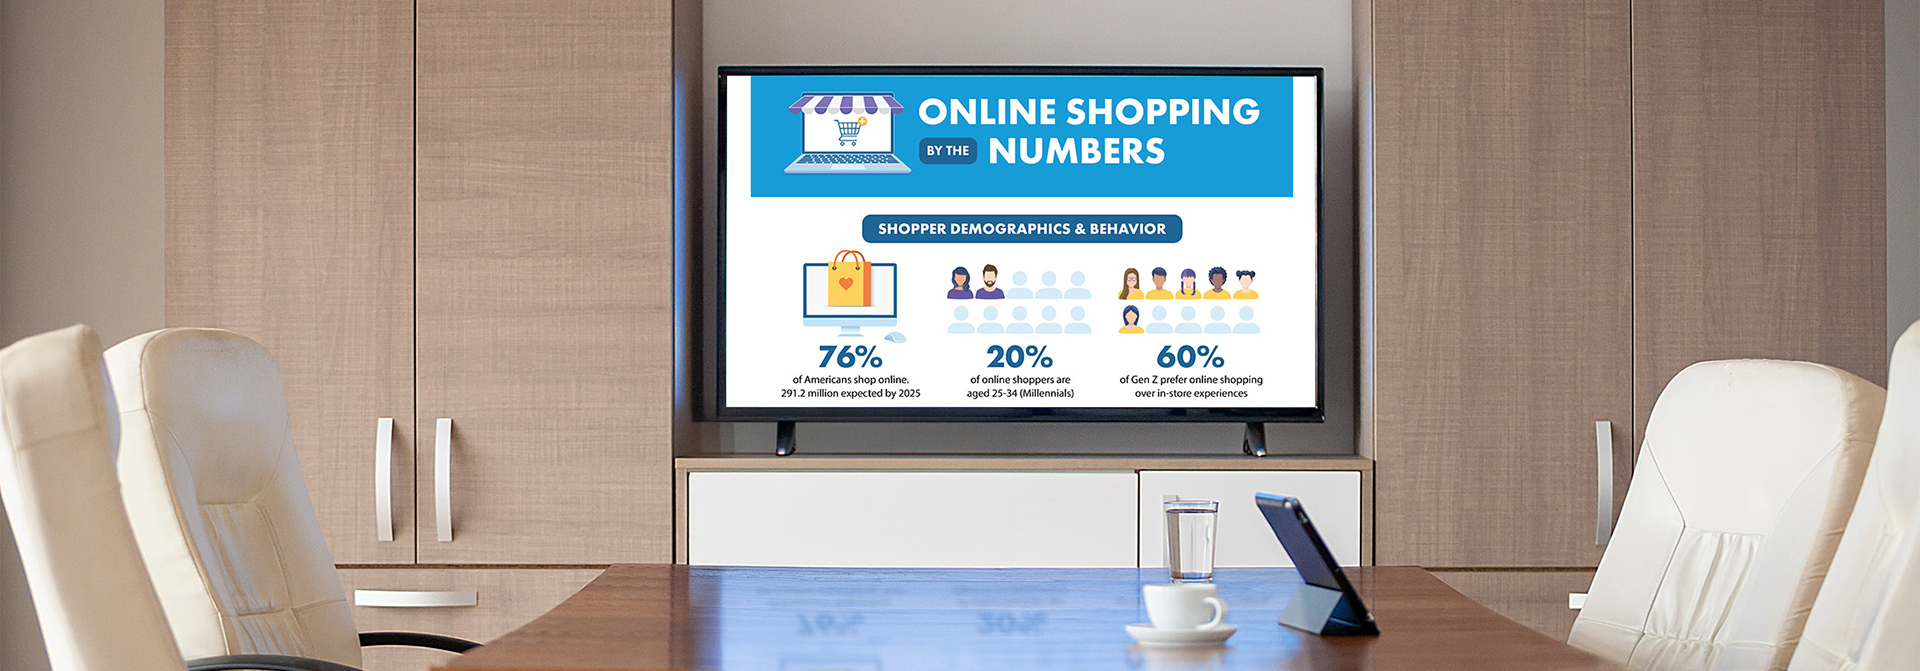
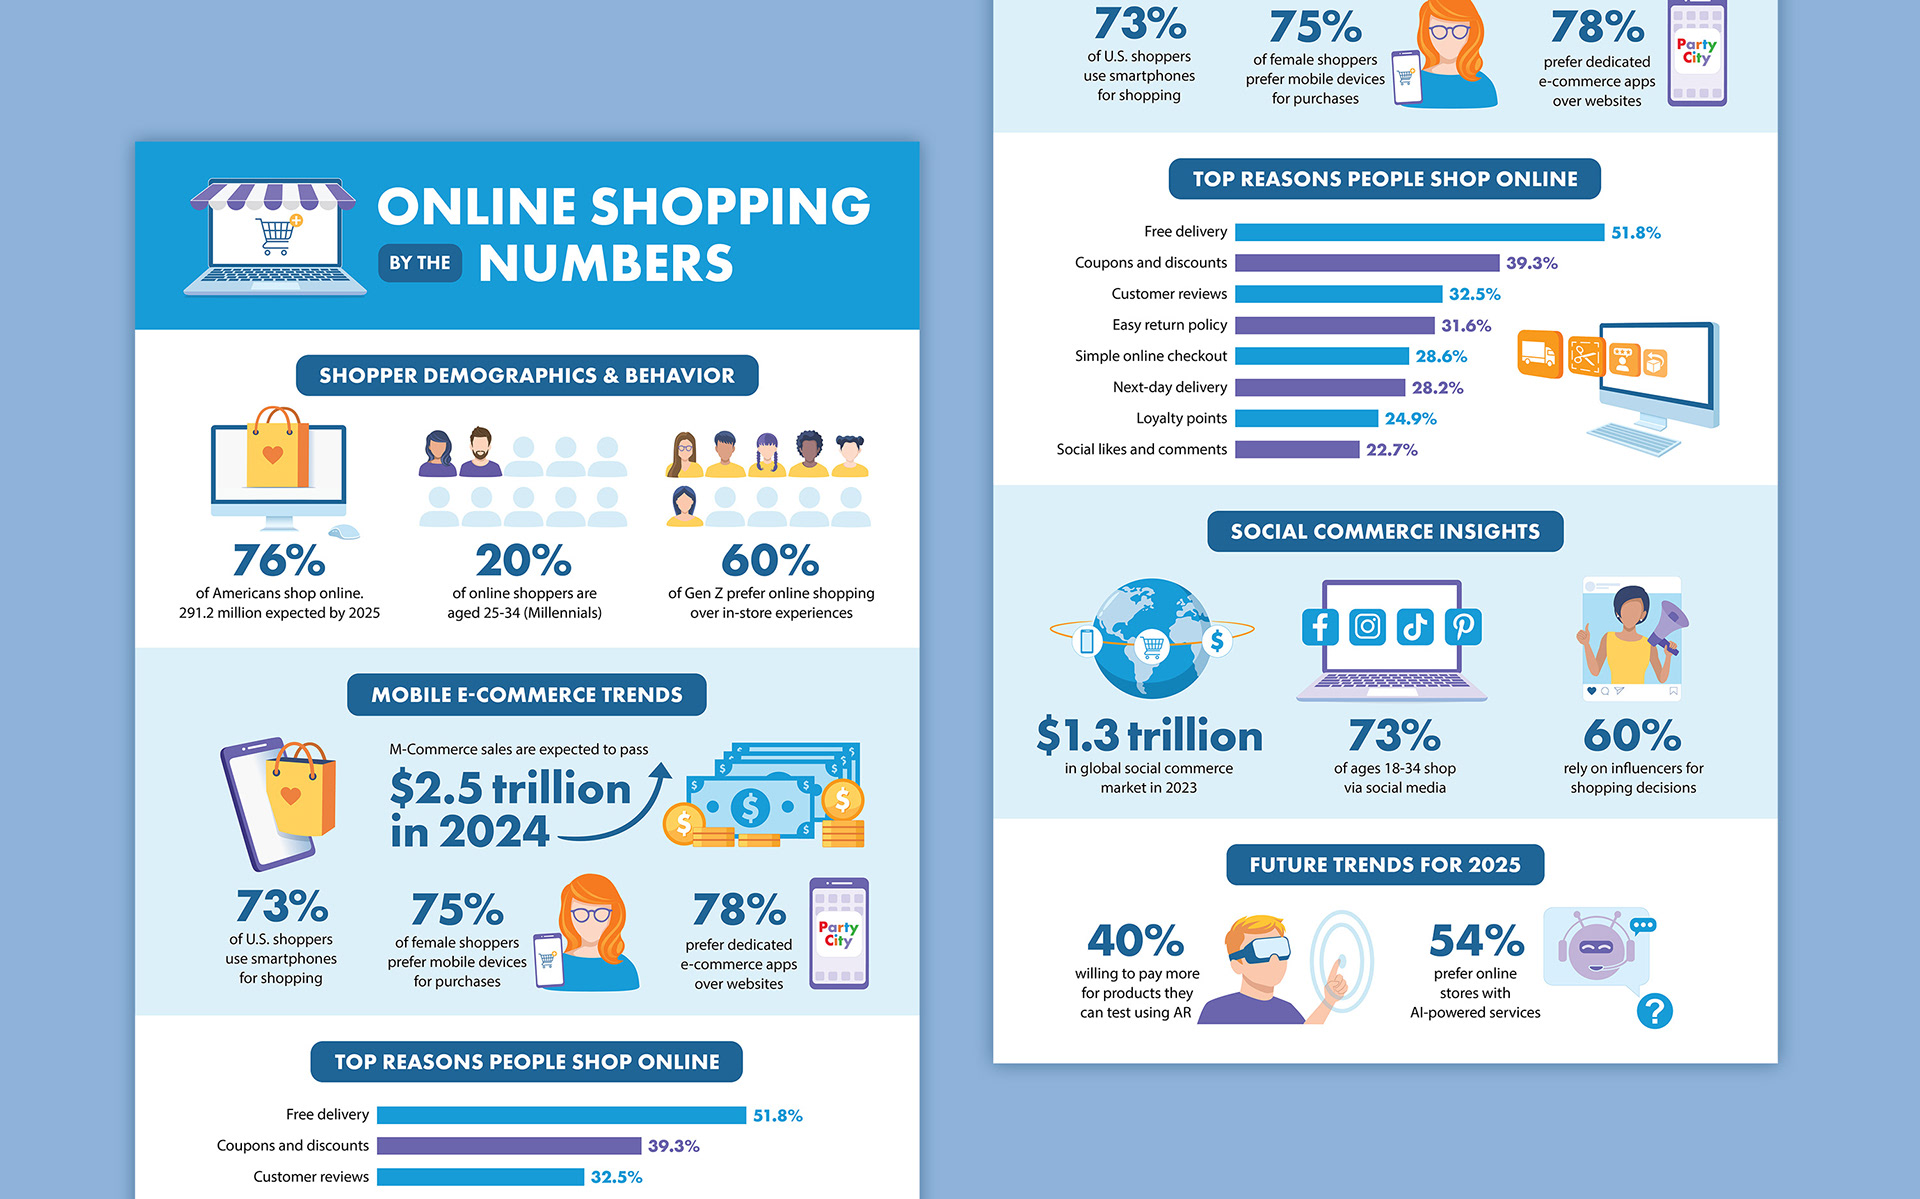
Online Shopping by the Numbers
This infographic was used as talking points in a presentation for the e-commerce office, sharing high-level metrics of online shopping in 2024. I collaborated with the SVP of E-Commerce to research and finalize the data used. My executions include, formatting the layout between the data and it's supporting graphic, and creating original icons aligned with the brand, from concept to final production.

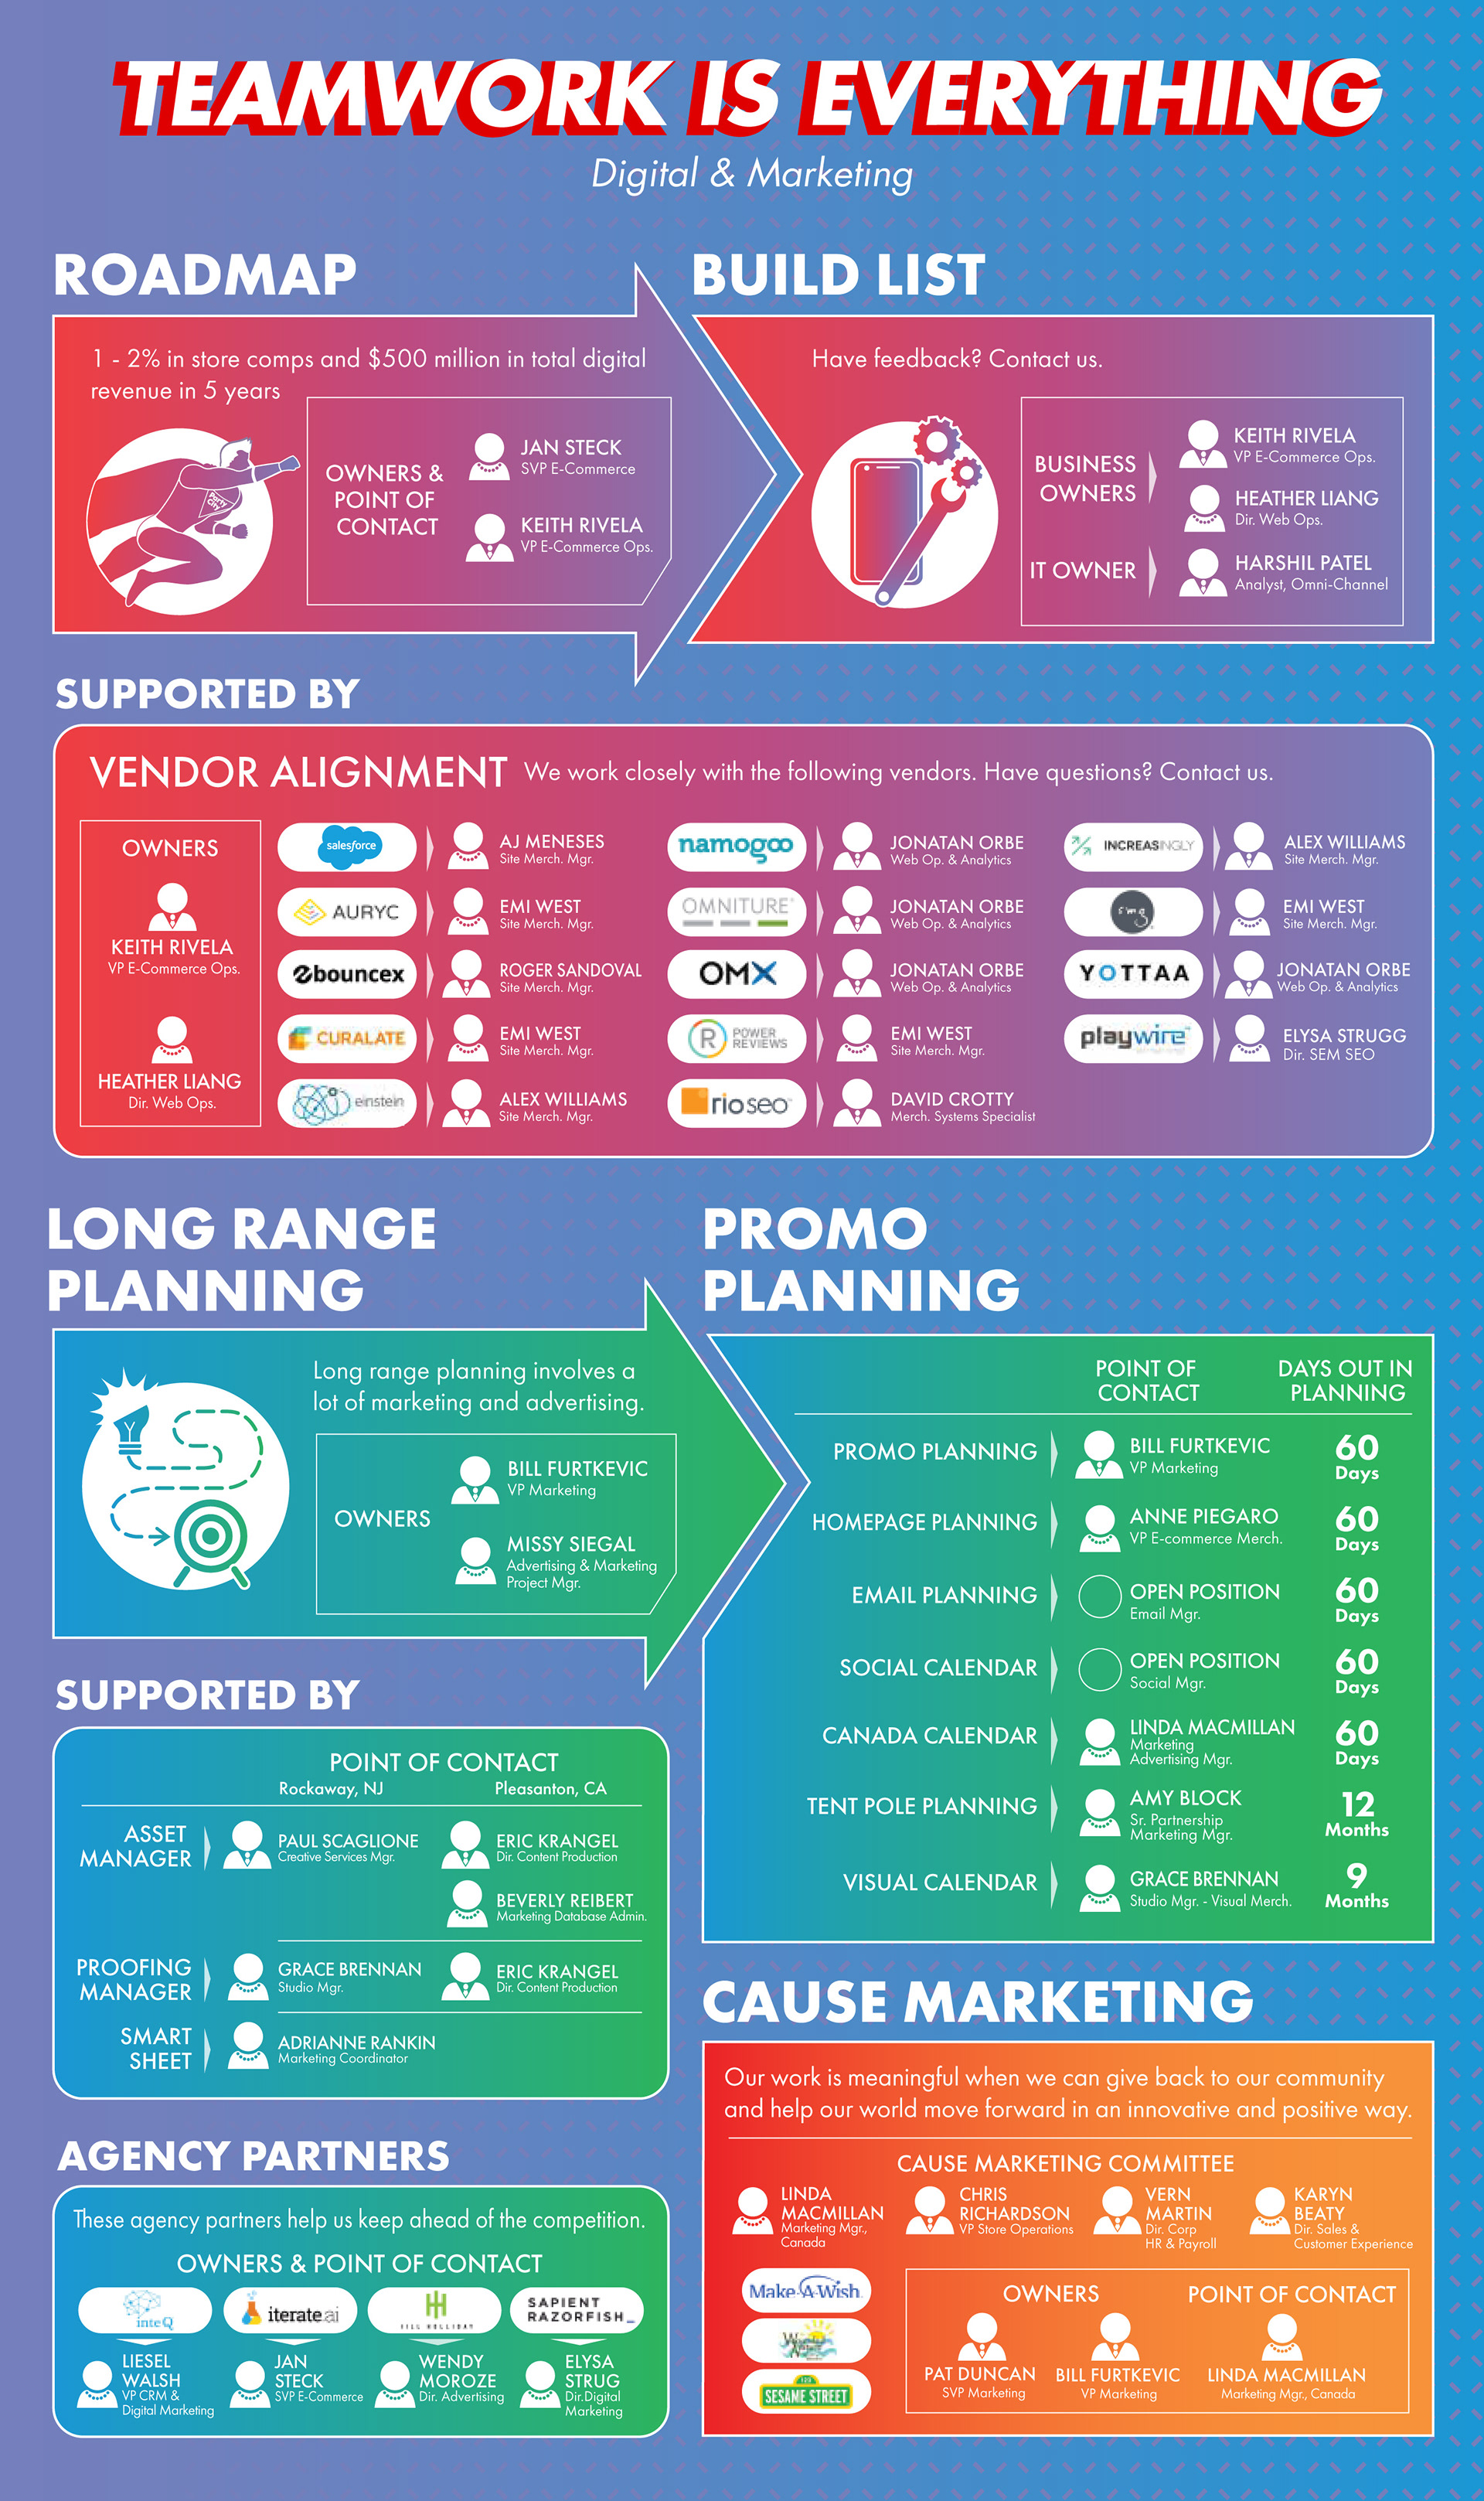
Fight for $500 Million
A campaign initiative for the Digital and Marketing teams to achieve a goal of hitting $500 million in total digital revenue in 5 years. I created the superhero-themed illustration and animation. It aligns with the company’s brand, and spearheaded the campaign design. I collaborated with the SVP of E-Commerce to create the infographic. It provides the roadmap and role clarity on how the teams work and points of contact for various vendor relationships.
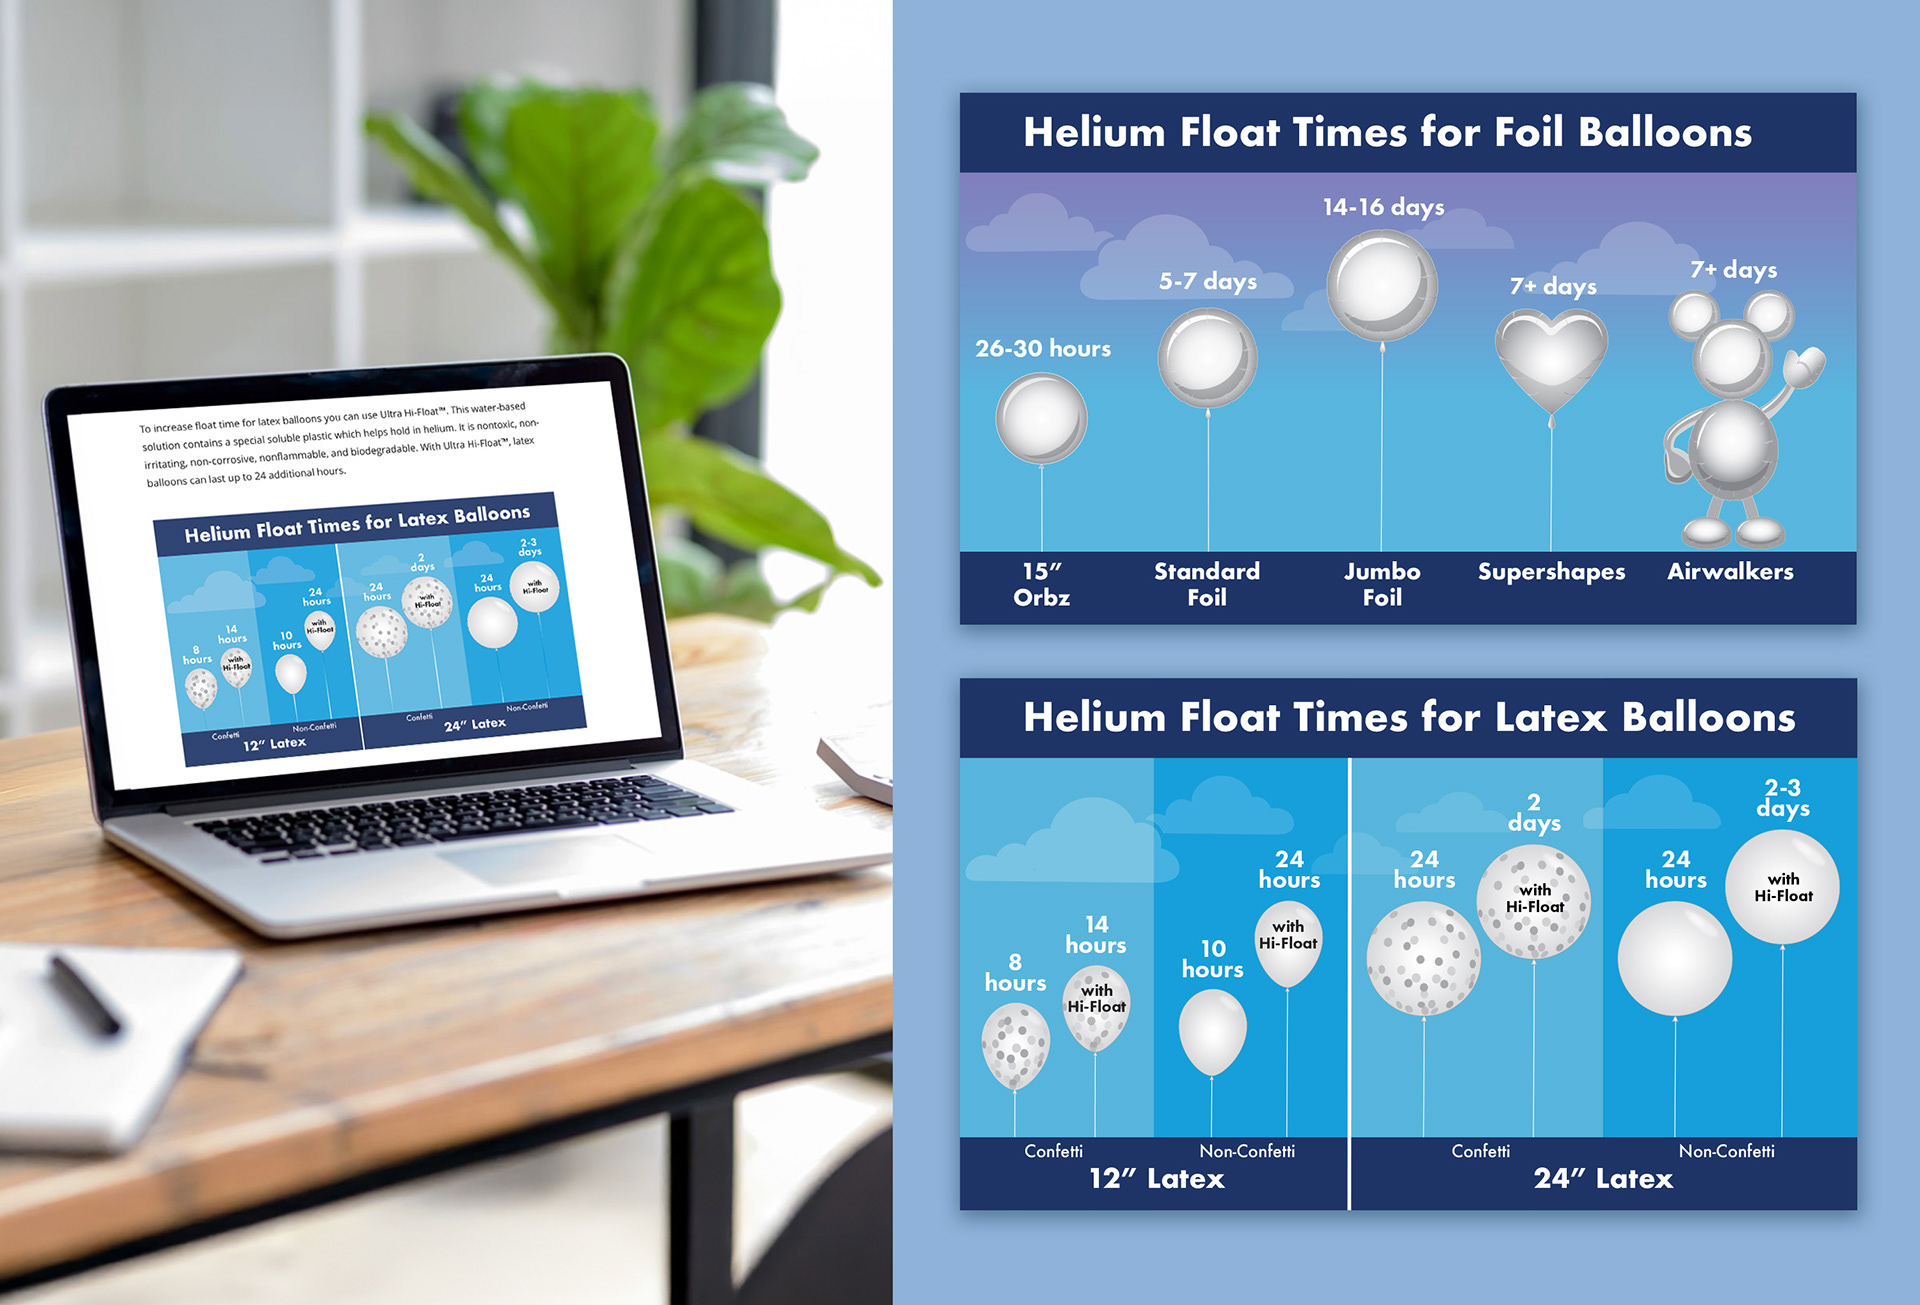
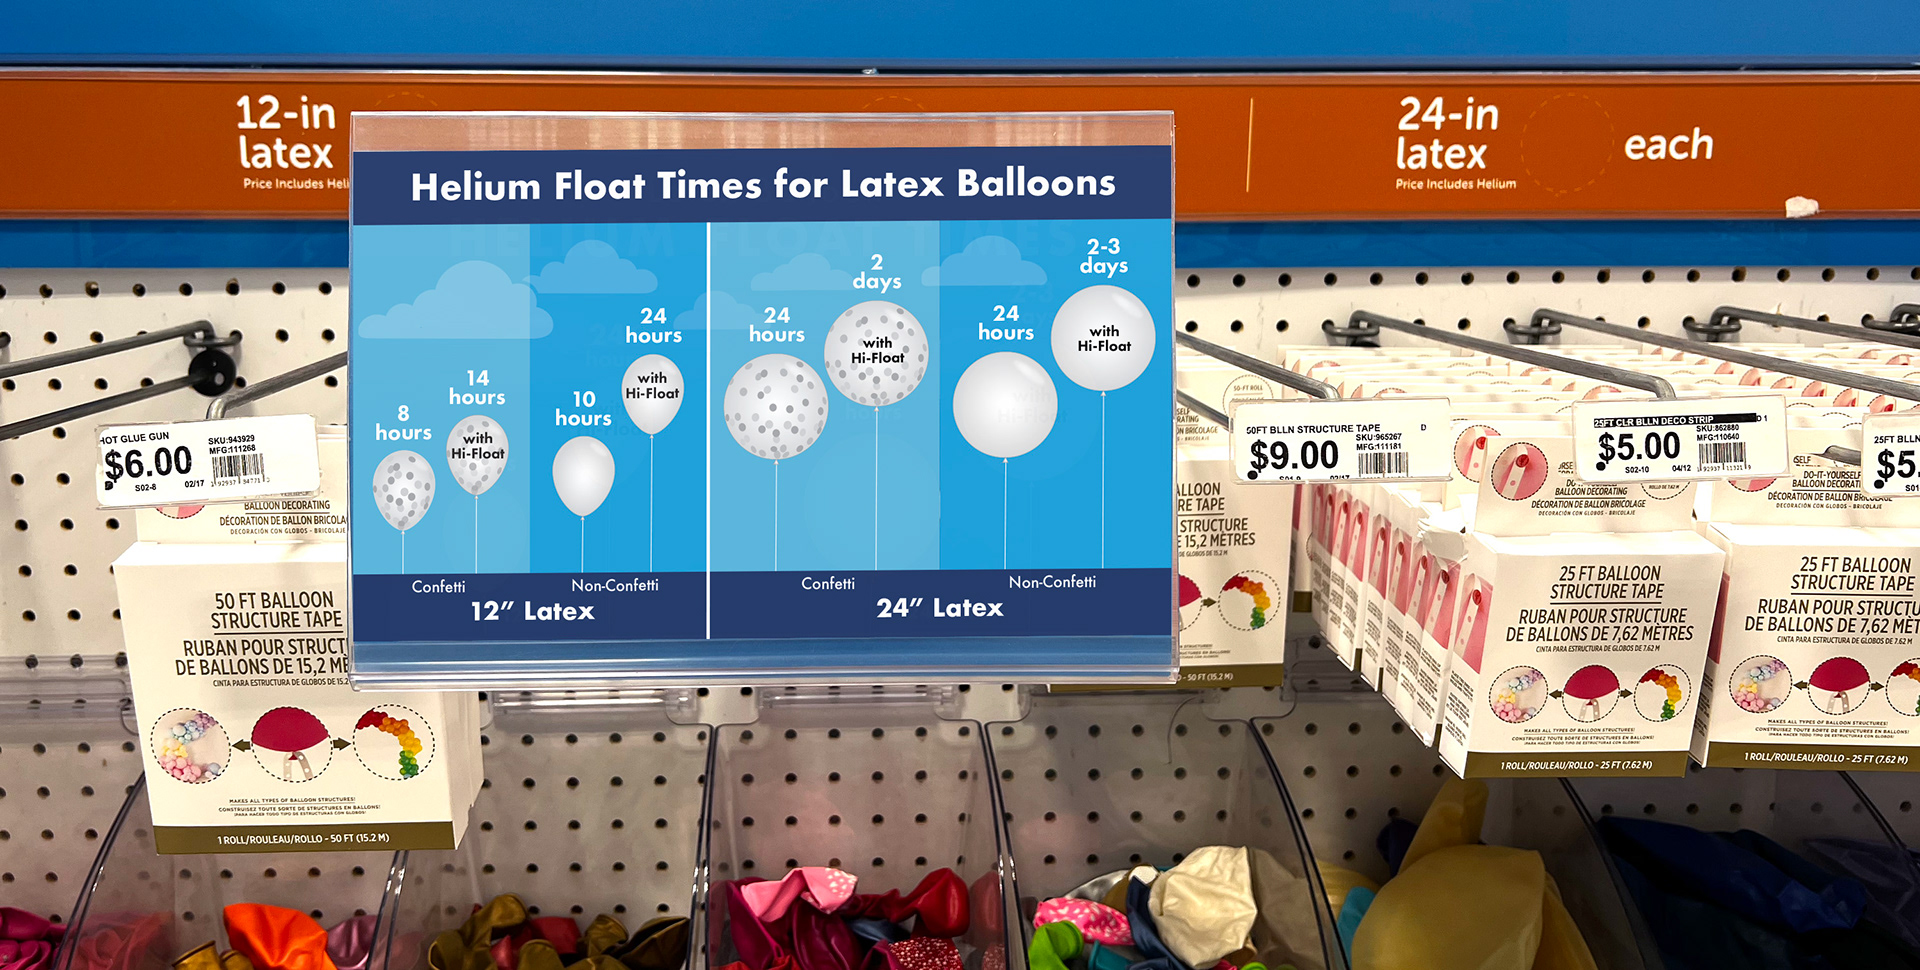
Helium Float Time Charts
A visual reference for customers both online and in-store to educate them on the specific float times for the variety of foil and latex balloons offered by Party City. I collaborated with products managers, and directors for data accuracy and design approval. The illustration style, color choices and font type were all aligned with the company's brand.
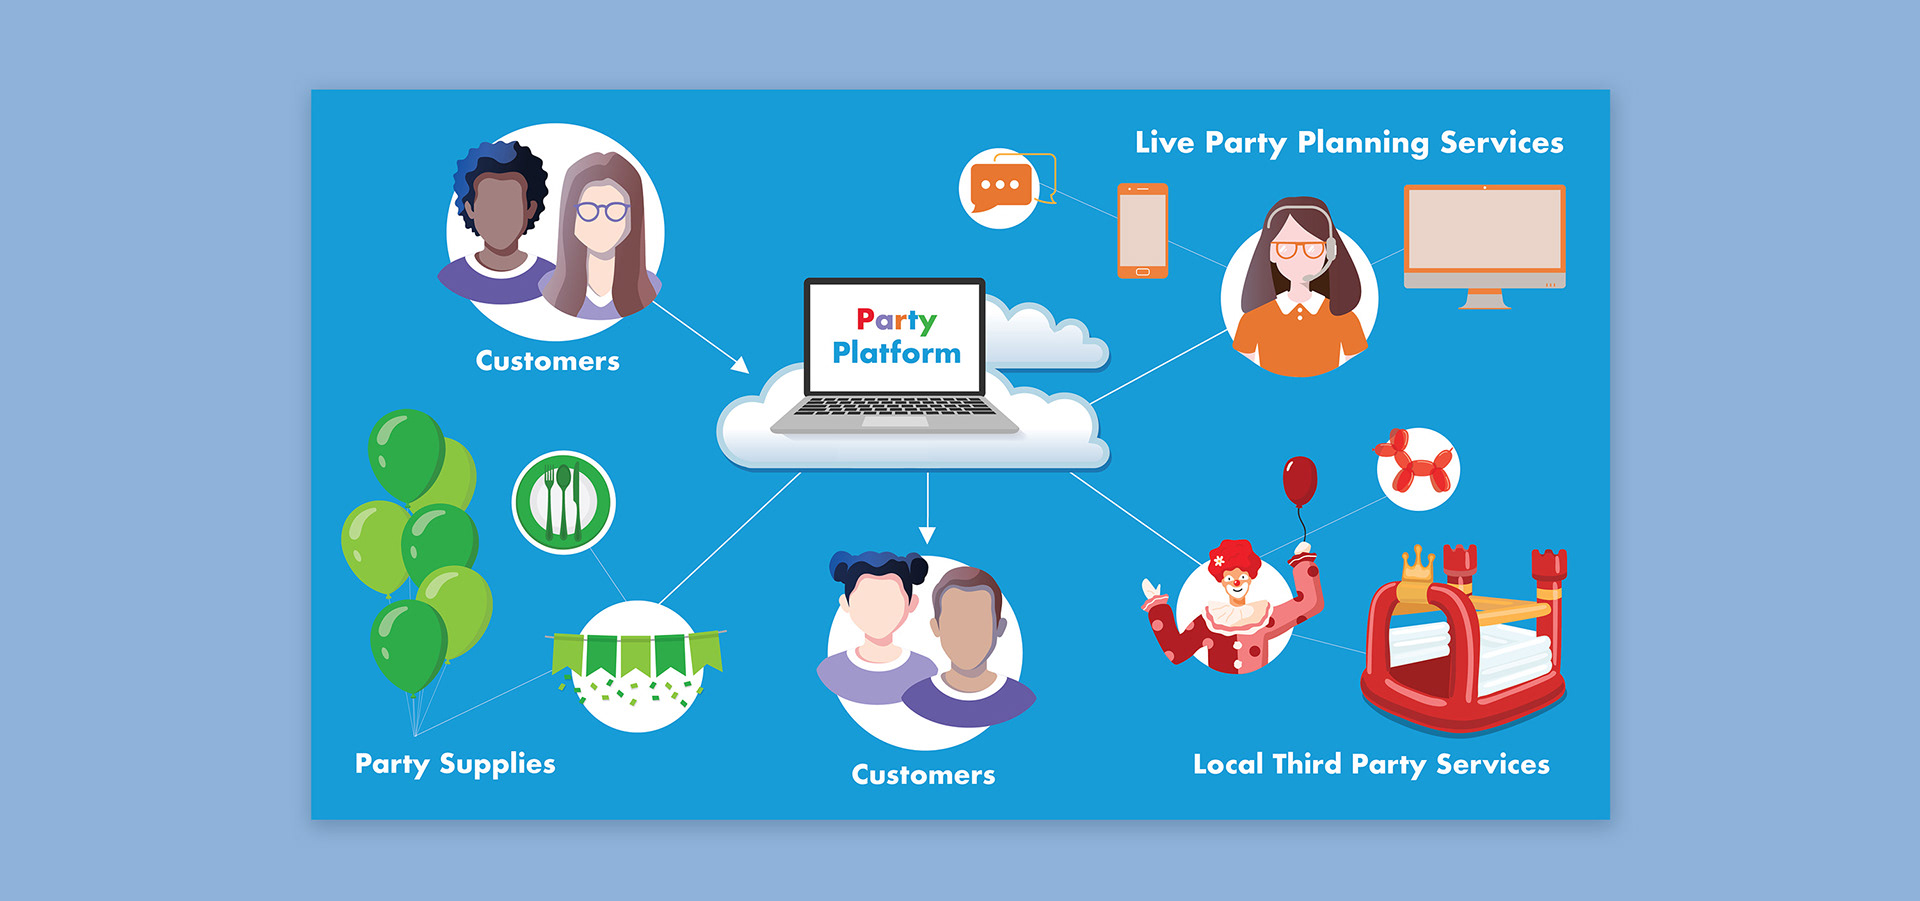
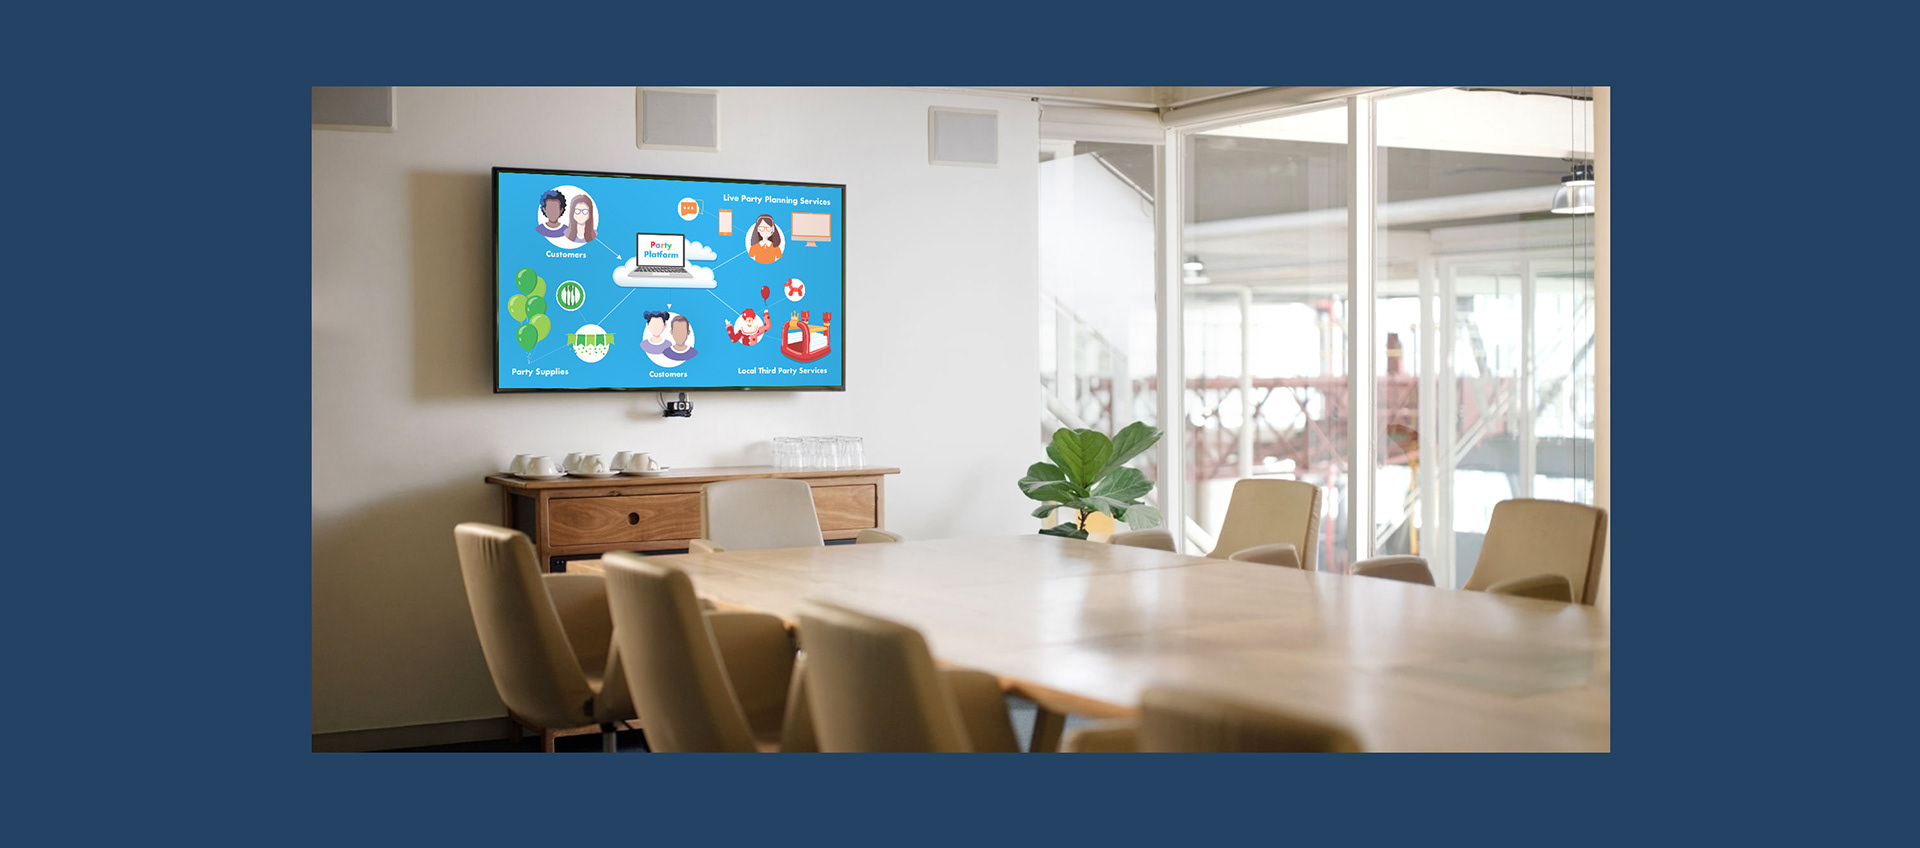
Party Platform
A quick high-level visual aid for an executive presentation illustrating a Party City initiative idea for a one stop shop hub for customers to browse, shop, and connect with not only Party City, but other third party vendors to fulfill all their party services. This was used to illustrate the platform covering all party needs from food caterers, decorations, entertainment, to live party planner connections. I collaborated with my director and the SVP of E-Commerce for data accuracy and design approval. The illustration style, color choices and font type all align with the company brand.